| Part I - Mineral Classification |

|
|
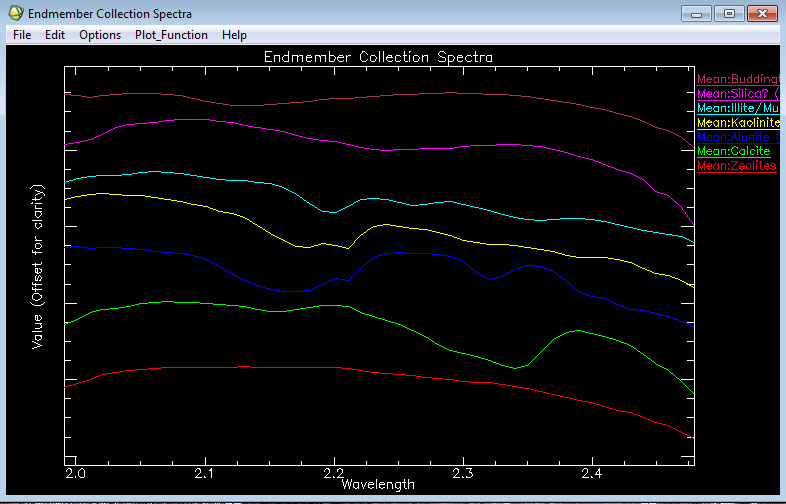
| Part I - Endmember Spectral Plot |
Here is spectral plot of the mineral endmembers. They are the same color as the mineral classification map.

|
|
| Part I - Mineral Abundances / RMS Error |
First image is rms error, white means more error. The second image is silica abundance which isn't very high as you would expect as looking from the classification map. Classification map just used silica i guess because it was just comparitively the most abundant but still not as abundant as it looks on the color classification map.
The third image is Ilite/Muscovite which is represented by classification map pretty well as you see white areas on the abundance map where you find cyan on the classification map.

|
|
|
|
|