| Part II |
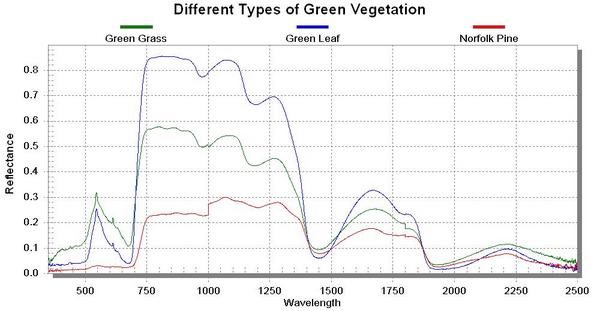 Here I plotted some different type of vegetation. The Norfolk Pine had dried out a bit on the trip to school so it looked a bit different than I think it should. For the leaf and grass you can see the peaking at green wavelengths and the red edge around 700. The grass has more visible reflectance but less NIR reflectance than the green leaf.
|
|
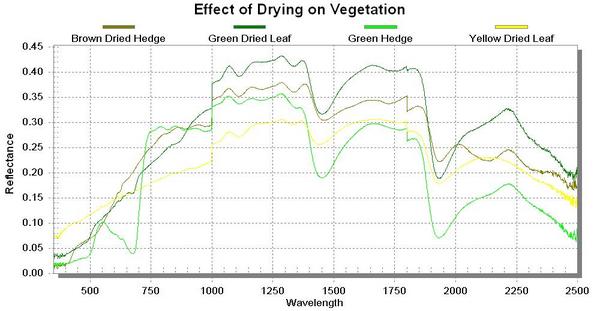
Here I wanted to show the effect of dried vegetation. For dried vegetation more red and blue light are reflected leading to a continuous increase in reflectance up to 700 nm instead of the red edge you see for green vegetation. The dried yellow leaf was actually not that dried out before I brought it to school. It was taken from a tree with green and yellow leaves on it.
|
|
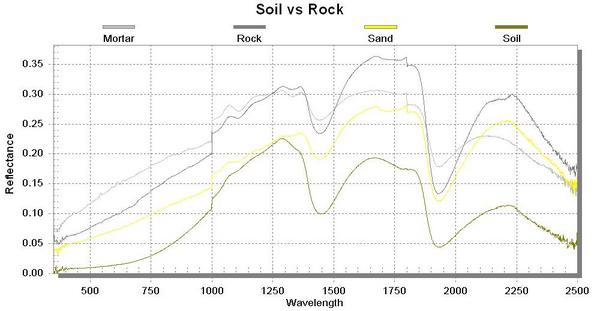
The dark soil absorbs more visible and NIR light than mortar or rock. Sand absorbed the same as soil from about 1100-1300 nm, otherwise sand absorbed less (reflected more).
|
|
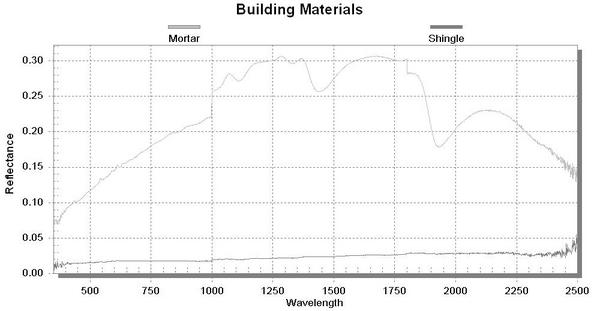
The shingle seemed to reflect very little unless this was an error with operating the spectrometer. I guess the shingle wouldn't be too great on your roof if it was absorbing too much solar energy (low albedo).
|
|
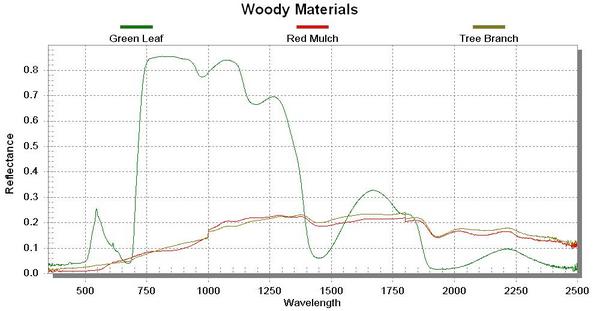
I wanted to compare woody materials to green leaves. You can see the red mulch having higher reflectance near red wavelengths which makes sense. Both mulch and tree branch have much less reflectance than green leaves in the NIR range except around 1400 nm and greater than 1800 nm. I assume the dips in reflectance for green leaves for these wavelengths is due to water in the leaves?
|
|
|
| Part III |
Here is a link to download the spectral library for this lab:
Spectral Library
|
|
|
|
|